
GPUs have become an important part of modern AI infrastructure. They are used for tasks such as AI model training, LLM inference, image processing, and other workloads that require high computing power.
However, simply having powerful GPUs does not mean they are being used efficiently. A GPU can be underused, overloaded, or affected by another resource such as memory, CPU, or storage.
This is why GPU utilization monitoring is important in production AI environments. By monitoring GPU usage, teams can understand how their infrastructure is performing, identify potential problems, and make better decisions about resource allocation.
In this guide, we will explain how to monitor GPU utilization in production AI infrastructure and what metrics are worth paying attention to.
What Is GPU Utilization?
GPU utilization shows how actively a GPU is being used by a workload.
A GPU utilization of 90%, for example, generally means the GPU is actively working for most of the time being measured. A very low utilization level may indicate that the GPU is sitting idle or waiting for other parts of the system.
However, GPU utilization alone does not tell the complete story.
A GPU can show high utilization while still having a memory problem, or it can show low utilization because the workload is waiting for data from the CPU or storage.
For this reason, GPU utilization should be viewed alongside other system metrics.
Why Monitor GPU Usage in Production?
Production AI workloads can be expensive to run, especially when they depend on powerful GPUs.
If a GPU is running continuously but only being used a small percentage of the time, the infrastructure may not be using its available capacity efficiently.
On the other hand, if GPU resources are consistently close to their limits, applications may experience slower response times or other performance problems.
By choosing to monitor GPU usage, teams can identify these situations and make informed changes to their infrastructure.
Monitoring can also help detect unusual behavior before it becomes a major problem.
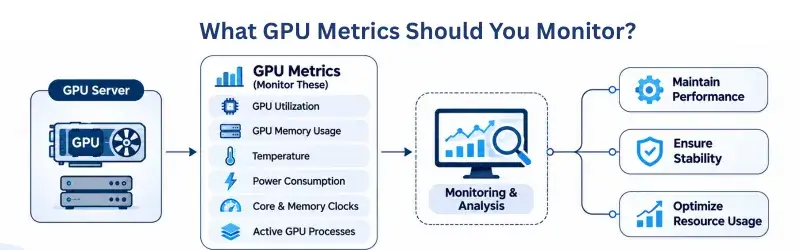
What GPU Metrics Should You Monitor?
There are several GPU metrics that can provide useful information about production workloads.
The most important ones include GPU utilization, GPU memory usage, temperature, power consumption, and performance.
Looking at these metrics together gives a much clearer picture of how a GPU is actually performing.
For example, a GPU may have 40% utilization but 95% memory usage. This tells a very different story from a GPU with 40% utilization and 20% memory usage.
The right metrics will also depend on the type of AI workload running on the system.
GPU Utilization
GPU utilization is usually the first metric people check.
It shows how actively the GPU’s processing resources are being used. Consistently high utilization may indicate that the GPU is being used efficiently, but extremely high utilization can also indicate that the workload is reaching its limits.
Low utilization does not always mean there is a problem. Some applications naturally use the GPU only when processing a request.
For example, an AI service with occasional traffic may show low average GPU utilization even though it performs normally.
GPU Memory Usage
GPU memory, often called VRAM, is another important metric.
AI models can require significant amounts of GPU memory. If memory usage gets too close to the available capacity, applications may experience errors or performance problems.
Monitoring memory usage can help identify whether a model is too large for the available GPU or whether multiple workloads are competing for the same memory.
It can also help identify memory leaks, where an application gradually consumes more GPU memory over time.
GPU Temperature
GPU temperature is another useful metric to monitor in production.
When a GPU is working heavily for long periods, it can generate significant heat. Modern systems have mechanisms to protect hardware from excessive temperatures, but sustained high temperatures can affect performance.
If a GPU becomes too hot, it may reduce its operating speed to control the temperature. This can result in lower performance.
Monitoring temperature can therefore help identify cooling problems, overloaded systems, or unusual workloads.
GPU Power Usage
Power consumption can also provide useful information about GPU workloads.
A GPU performing heavy calculations will generally consume more power than one sitting mostly idle.
Unexpected changes in power usage can sometimes indicate changes in workload behavior.
For large AI infrastructure environments, power monitoring can also be useful for understanding operating costs and planning capacity.
How to Monitor GPU Usage on Linux
Linux provides several tools that can help you check GPU usage.
For NVIDIA GPUs, one of the most commonly used tools is:
nvidia-smiThis command provides information about the GPU, including utilization, memory usage, temperature, power usage, and running processes.
It is useful for quick checks when troubleshooting a server.
For example, if an AI application suddenly becomes slow, nvidia-smi can help determine whether the GPU is heavily loaded or whether another issue may be responsible.
Why Production Monitoring Needs More Than nvidia-smi
nvidia-smi is useful for checking the current state of a GPU, but production systems need historical information as well.
For example, knowing that a GPU is using 95% capacity right now is useful. But knowing that it has been above 90% for the last six hours is much more valuable for capacity planning.
Production monitoring systems collect metrics continuously and store them so teams can view trends over time. This makes it easier to identify recurring problems, traffic patterns, resource shortages, and underused hardware.
Using Monitoring Dashboards
A monitoring dashboard can bring important GPU metrics into one place.
Instead of checking individual servers manually, teams can view GPU utilization, memory usage, temperature, and other metrics from a central dashboard.
Dashboards are especially useful when an organization operates multiple AI servers or GPUs. A good dashboard should make it easy to identify which systems are healthy and which ones may require attention.
Graphs showing GPU usage over time can also help teams understand whether resource consumption is increasing as the application grows.
Setting Alerts for GPU Problems
Monitoring becomes much more useful when it can notify you about important problems.
For example, you can create alerts when GPU memory remains unusually high, temperatures reach unsafe levels, or utilization stays at a very high level for an extended period.
Alerts should focus on conditions that actually require attention.
If alerts are triggered too frequently, teams may start ignoring them. This is why thresholds should be based on the normal behavior of the workload rather than arbitrary numbers.
For example, a GPU that regularly reaches 90% utilization during normal operation may not need an alert every time it reaches that level.
Monitor GPU Usage Alongside CPU and RAM
GPU monitoring should not be treated as a separate activity from general server monitoring.
AI workloads often depend on CPU, RAM, storage, and networking as well.
For example, an AI model may be ready to process a request, but the required data may not arrive quickly enough from the CPU or storage system.
In that situation, GPU utilization could remain low even though the application is experiencing slow performance.
Monitor GPU Memory and Inference Performance
For AI inference systems, GPU utilization should also be compared with application performance.
Metrics such as response time, requests per second, and processing time can help explain whether the GPU is providing the expected performance.
For example, a GPU may be running at high utilization while response times are increasing. This could indicate that the system needs additional GPU capacity.
Similarly, low GPU utilization combined with slow application performance may suggest that the bottleneck exists somewhere else.
This is why AI infrastructure monitoring should include both hardware and application-level metrics.
Monitoring Multiple GPUs
Production AI systems often use more than one GPU.
When multiple GPUs are available, it is important to monitor each GPU separately. One GPU may be heavily loaded while another remains mostly idle.
This can happen because of application configuration, workload distribution, or scheduling issues.
Monitoring individual GPUs makes it easier to identify uneven resource usage and determine whether workloads are being distributed efficiently.
GPU Monitoring for Kubernetes and Containers
Many modern AI workloads run inside containers or Kubernetes environments.
In these environments, GPU monitoring needs to consider both the physical GPU and the workloads using it.
You may want to know which application or container is using a particular GPU, how much memory it is consuming, and whether the workload is receiving the resources it was assigned.
This information becomes increasingly important as more applications share the same AI infrastructure.
Common GPU Monitoring Mistakes
One common mistake is looking only at GPU utilization.
As mentioned earlier, utilization does not show everything. GPU memory, temperature, power usage, CPU performance, and application response time can all provide important information.
Another mistake is monitoring only the current GPU state. Production systems need historical data to identify trends and recurring problems.
It is also important not to create too many alerts. Monitoring should help teams focus on real problems rather than generating constant notifications.
Finally, make sure monitoring covers every GPU in the environment. A single underperforming GPU can affect an entire application when workloads are distributed across multiple devices.
Best Practices for GPU Utilization Monitoring
A good GPU monitoring strategy should start with the metrics that matter most to your workload.
Track GPU utilization and memory usage as basic indicators. Add temperature and power monitoring when hardware health and operating costs are important.
Connect GPU metrics with application performance so you can understand how infrastructure affects the user experience.
Keep historical data so you can identify trends and plan future capacity.
Finally, create meaningful alerts for situations that require action. The goal of monitoring is not to collect every possible metric. It is to make it easier to understand the health and performance of your AI infrastructure.
Final Thoughts
Monitoring GPU resources is an important part of managing production AI infrastructure.
GPU utilization can show how actively a device is working, while memory usage can reveal whether an AI model is approaching the limits of available VRAM. Temperature and power metrics can provide additional information about hardware health and resource consumption.
Tools such as nvidia-smi are useful for quick checks, while production environments benefit from continuous monitoring, dashboards, historical data, and meaningful alerts.
Most importantly, do not look at GPU metrics in isolation. Combine GPU utilization monitoring with CPU, RAM, storage, networking, and application performance metrics.
This gives you a much clearer picture of how your AI infrastructure is performing and helps you make better decisions about scaling, optimization, and resource allocation.